

Cold Plasma / UC10
Use case UC10 · CO₂ and PAW
One gliding arc system to process CO₂ and produce PAW
The research behind UC10 used a single gliding arc plasma system to study two outcomes together: changes in gas composition inside a closed chamber, and production of plasma-activated water (PAW) for growing seedlings. This page summarizes what was measured, the limitations and what to measure before testing with your own gas and water.
Research by Assoc. Prof. Dr. Siwapon Srisonphan and the Plasma Innovations team, Department of Electrical Engineering, Kasetsart University
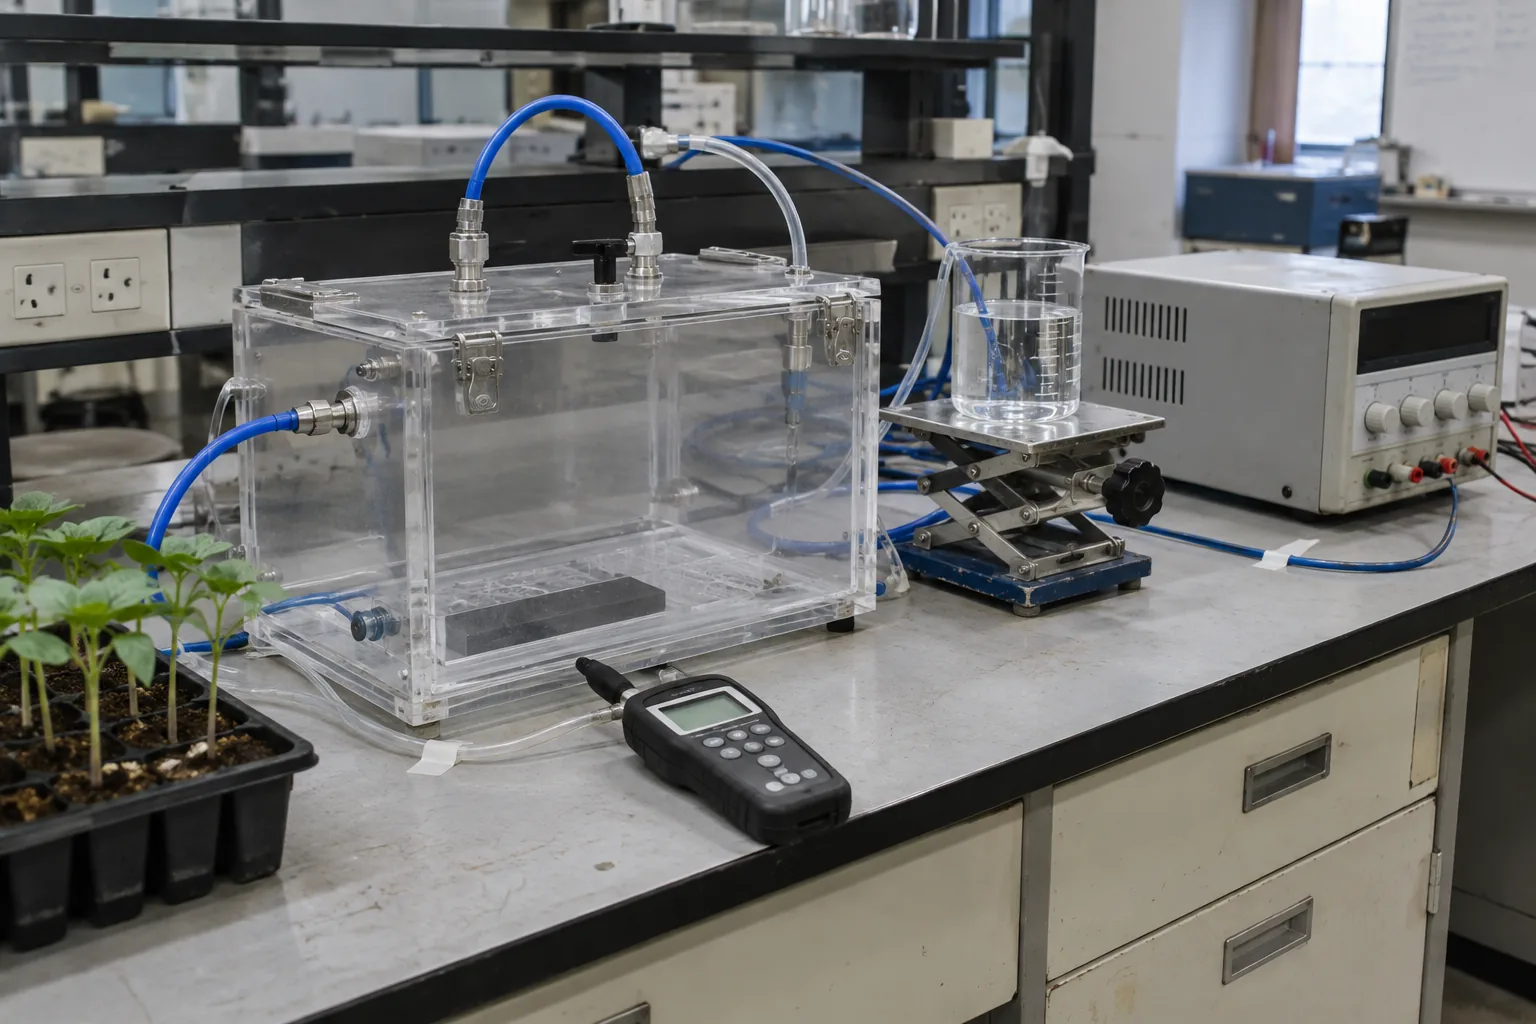
≈7,500 → 600 ppmCO₂ in a closed 56.6 L chamber within about 10 minutes with gliding arc on at the higher starting concentration (the plasma-off group approached 1,000 ppm after about 70 minutes)
≈1,000 → 600 ppmCO₂ in the same closed chamber over 35 minutes with plasma on at the lower starting concentration
12 daysSunflower seedlings given PAW (30-minute generation) were significantly longer and heavier than DI water seedlings (p < 0.05) under the studied conditions
Figures in this article are laboratory results under the conditions of the cited studies. Results with your own lot or growing system need to be tested.
One system, two outcomes: changed gas and PAW
CO2 may already be present in production, energy use or exhaust. The research behind UC10 used a single gliding arc plasma system to study two routes together. The gas route tracks composition changes and carbon destinations; the water route assesses whether water exposed to plasma chemistry becomes PAW with a useful function. [1]
- Gas outcomes: CO2 · CO · O3 · outlet-gas composition
- Water outcomes: pH · electrical conductivity (EC) · H2O2 · NO3− · application performance
- System outcomes: energy · throughput · repeatability · safety
Results on this page come from laboratory experiments and depend on feed-gas composition and experimental conditions. [1]
In the wider picture, the IPCC concludes that human activities have unequivocally caused global warming. Reducing emissions at their source remains central, while concentrating CO2, converting CO2 to CO and permanently storing carbon have different outcomes and must be assessed by what each system does. [2]
Keep in mindGlobal mean CO2 in 2024 was 422.7 ppm [3]. This is a global atmospheric value, measured on a different basis from concentrations in the closed UC10 chamber.
Why use gliding arc to study gas and water in one system
A gliding arc uses the electric field between two electrodes to initiate a discharge. Gas flow moves and stretches the arc along the electrodes. Plasma electrons transfer energy to gas molecules, driving excitation and chemical reactions, and water can be positioned near the discharge. [1], [4]
In this study, a CO2–air mixture circulated through the plasma region inside a 56.6-liter chamber. The researchers tracked gas composition over time and used optical emission spectroscopy (OES) to characterize plasma light emission and species associated with the discharge. [1]
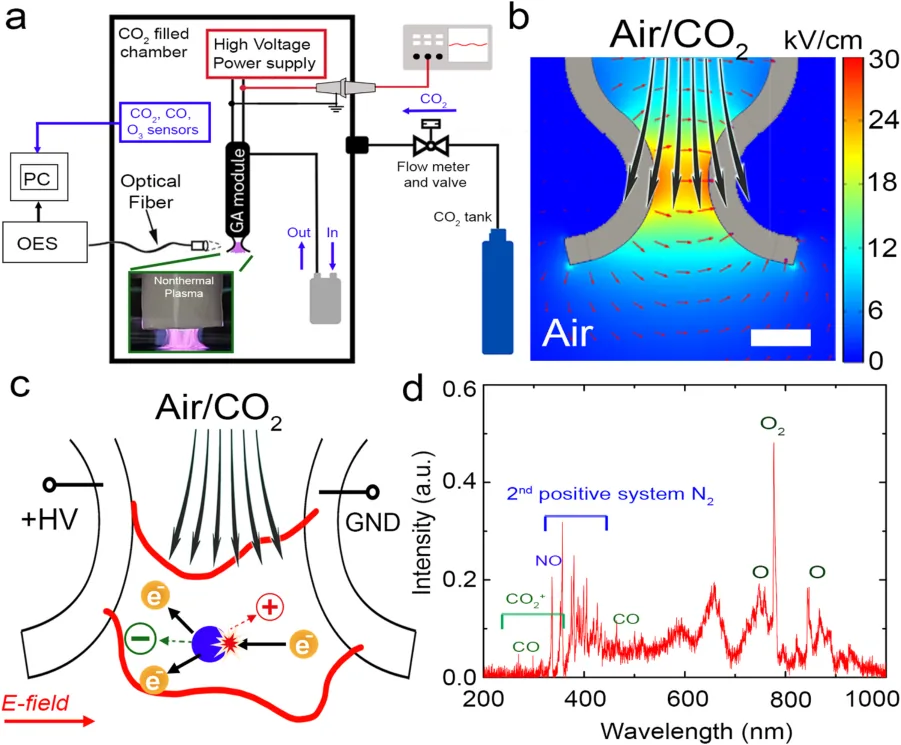
This table summarizes how three commonly compared discharge types generate plasma. [1], [4], [5]
| Type | Discharge characteristics | Key considerations |
|---|---|---|
| DBD | A dielectric barrier covers at least one electrode side. Discharge may be filamentary or diffuse depending on conditions. | Electric-field distribution, barrier material, gap and discharge uniformity |
| Corona | Ionization begins in a high-field region, such as a sharp tip or wire, without requiring an arc across the electrode gap. | Plasma location, gas flow and contact with the discharge region |
| Gliding Arc | An arc starts at the narrow electrode gap, then gas flow stretches it along the electrodes. | Arc stability, contact time, temperature and energy input |
What was measured: gas, water and seedlings
Gas trials compared plasma on and off at initial CO2 levels of approximately 1,000 and 7,500 ppm. Water trials placed 500 mL of distilled water below the plasma region and tracked PAW generation for up to 60 minutes. [1]
| Study component | Measurements | Question |
|---|---|---|
| Gas in the chamber | CO2, CO and O3 over time | How does gas composition change with plasma on compared with the control? |
| Water exposed to plasma | pH, conductivity, H2O2 and NO3− | How do water properties change with generation time? |
| Sunflower seedlings | Length and fresh weight | Does PAW produce a different response from DI water under the same cultivation conditions? |
Keep in mindppm (parts per million) describes concentration and tracks its changes. Assessing the quantity of converted carbon also requires volume, flow and product measurements.
Gas results: CO₂ fell from about 7,500 to 600 ppm in 10 minutes
At the higher starting concentration, the article reports CO2 decreasing from approximately 7,500 to 600 ppm within 10 minutes with gliding arc on, while the plasma-off group approached 1,000 ppm after about 70 minutes. At the lower starting concentration, it reports approximately 1,000 to 600 ppm with plasma on. [1]
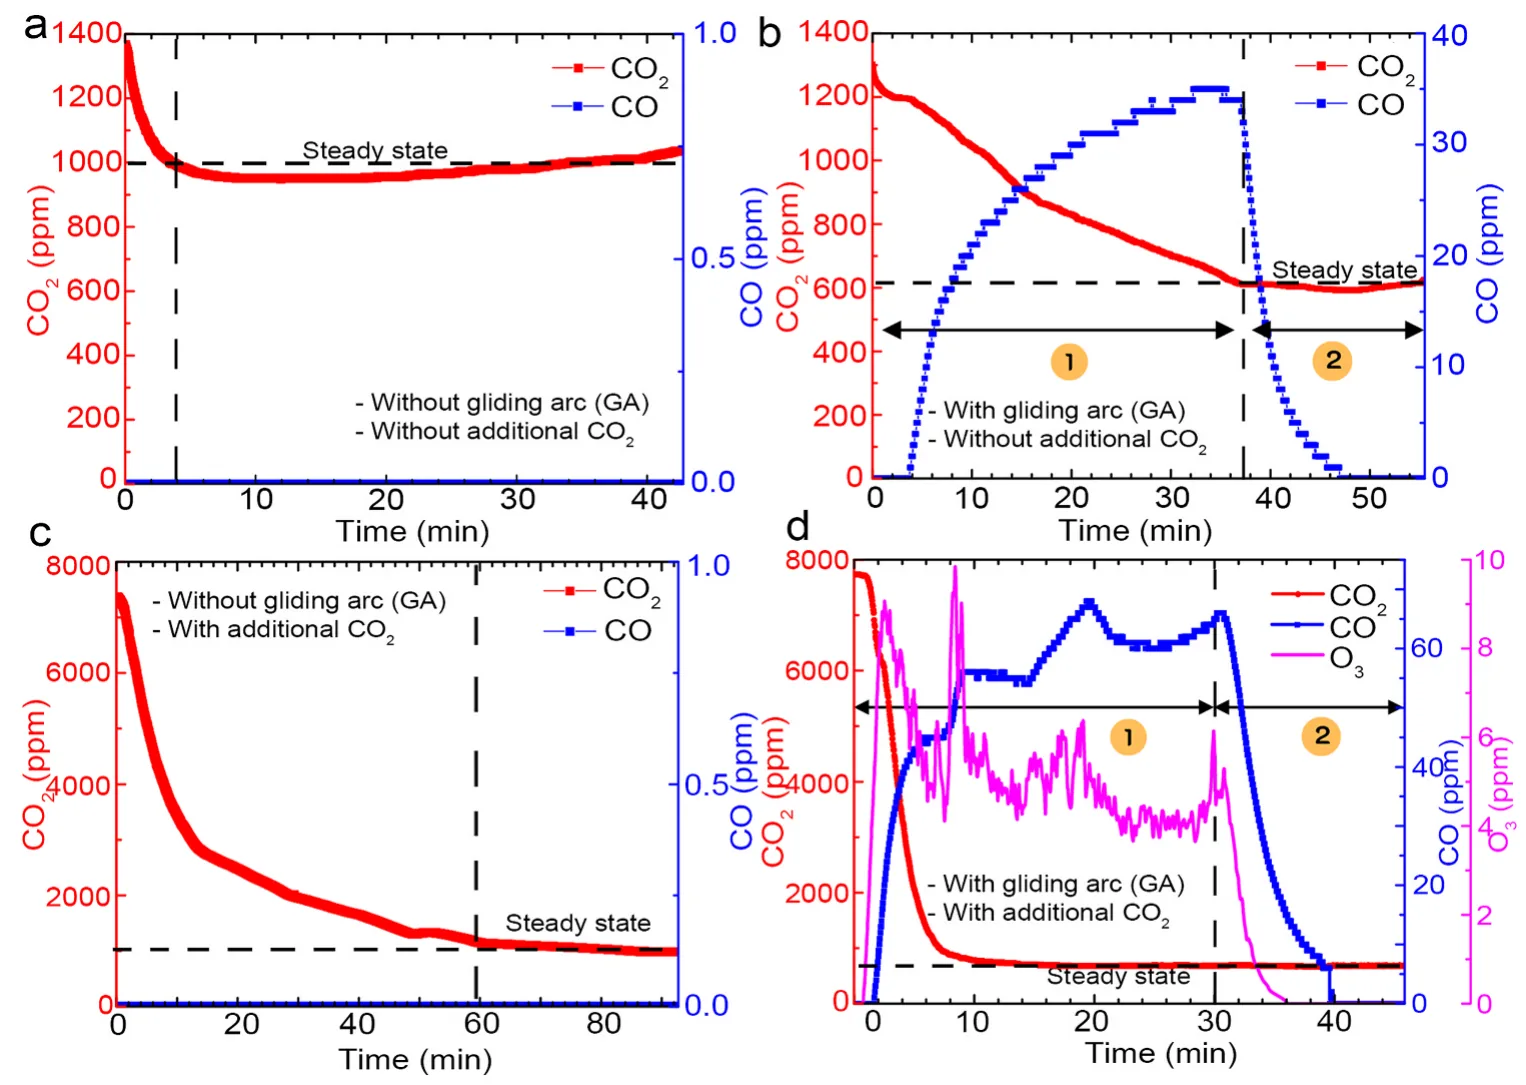
Keep in mindCO2 also declined in the control. The article discusses possible leakage or surface adsorption, so plasma-on results must always be read alongside the control. These are concentrations in a closed chamber: a fall in ppm is not net carbon removal or capture. [1]
Initial concentration affects system behavior. Read CO2 together with CO and O3 over time, because several gas components change at once. The example reactions below illustrate CO2 conversion and O3 formation in the gas mixture. [1]
- CO2 + e− → CO + O + e−
- O + O2 + M → O3 + M
From gas to water: how PAW changes
When gas and water share a system, some plasma-generated species transfer into the water and react further at the gas–water interface and in the liquid. A CO2–air mixture therefore involves carbon, oxygen and nitrogen chemistry. [1]
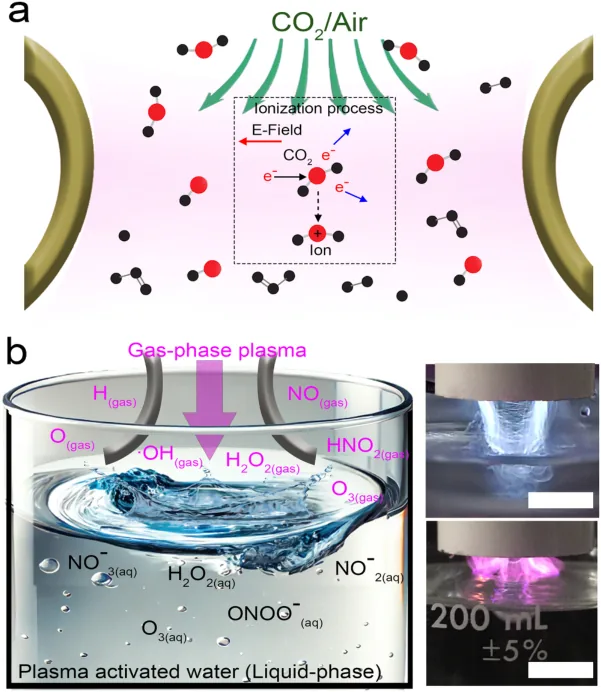
The example equations below illustrate pathways associated with nitrate and hydrogen peroxide formation in the gas–water system. The study quantified H2O2 and NO3− to characterize how the water changed. [1]
- N + O2 → NO + O
- NO + O + M → NO2 + M
- 3NO2 + H2O → 2HNO3 + NO
- HNO3 → H+ + NO3−
- •OH + •OH → H2O2
During PAW generation, the water became more acidic and more conductive, while measured hydrogen peroxide (H2O2) and nitrate (NO3−) increased. These results show chemical changes in the water after plasma exposure. [1]
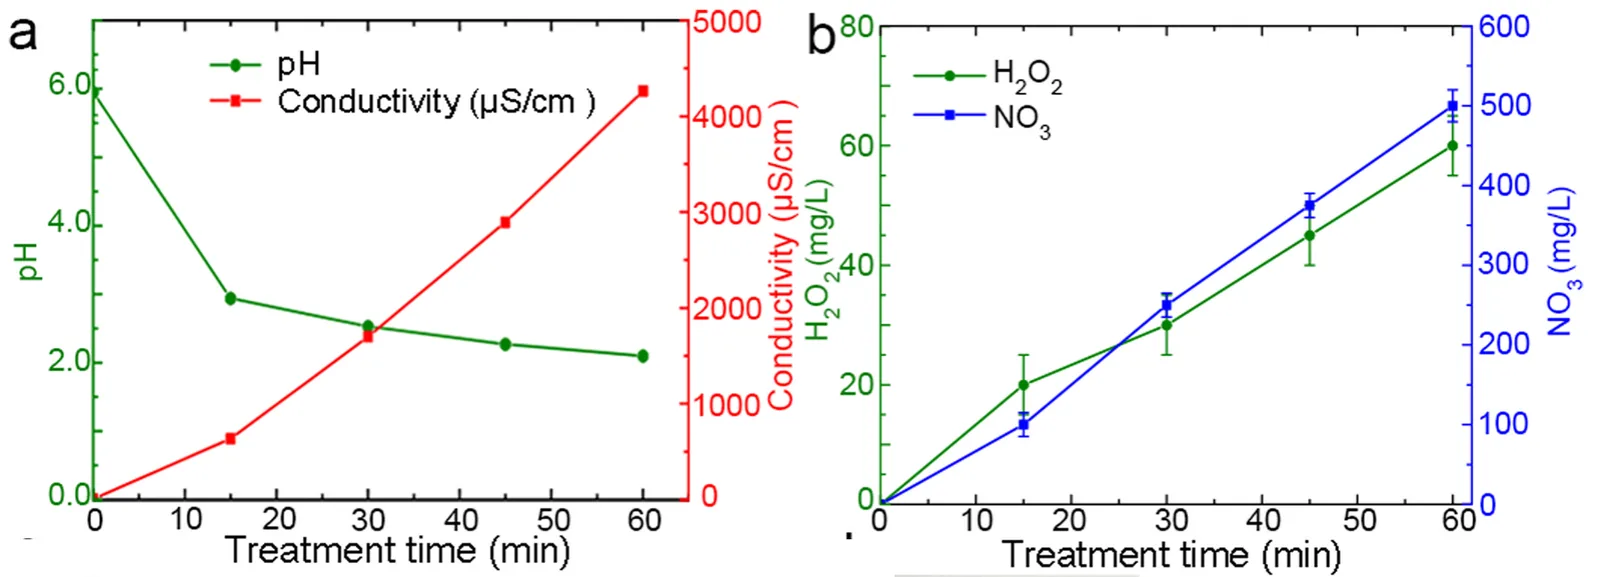
- Lower pH: indicates a change in acidity
- Higher conductivity: consistent with more ions in solution, but does not identify the ions
- H2O2 and NO3−: indicate oxidizing species and nitrate-form nitrogen relevant to subsequent application tests
Keep in mindFor repeatable PAW use, specify the source water, post-generation properties and the interval before application for every production run.
Sunflower seedling results over 12 days
The researchers compared PAW with deionized (DI) water in sunflower cultivation for 12 days. Each group had 4 replicates of 100 seeds under matched growing conditions. The reported growth results refer to PAW generated for 30 minutes. [1]
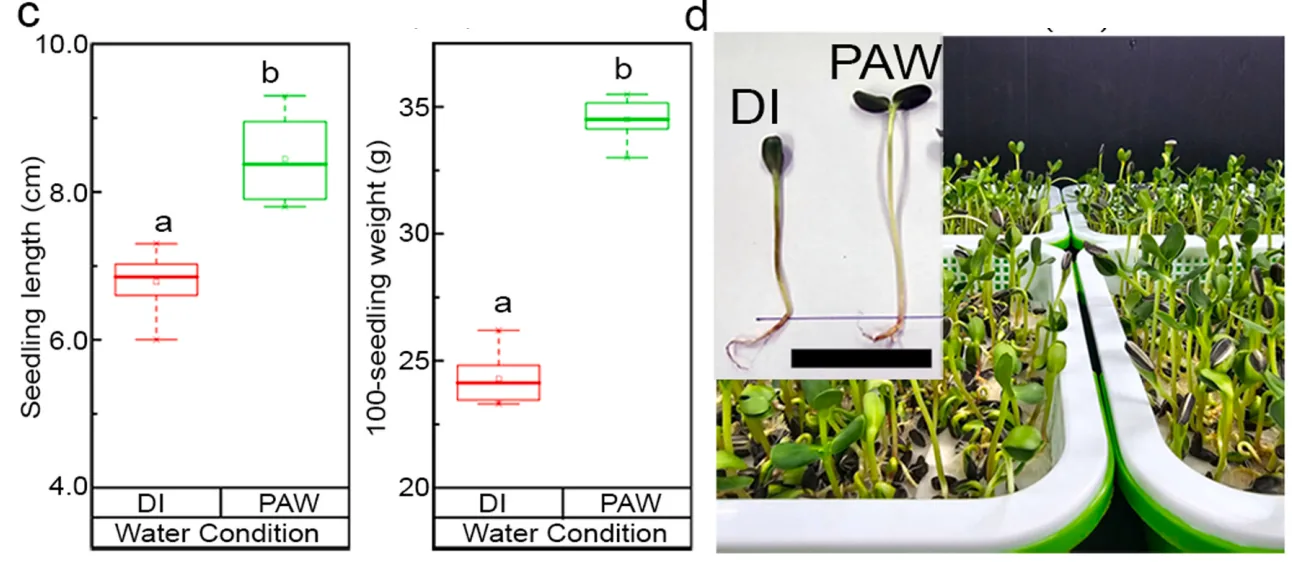
Under the studied conditions, PAW produced significantly longer seedlings with higher fresh weight than DI water (p < 0.05). [1]
Keep in mindPAW may act through several components together, including nitrate, oxidizing species, pH and dissolved ions, which may change the environment seeds and roots encounter in early growth. Further trials should use the actual crop, source water and cultivation method, measuring plant outcomes alongside water properties.
Energy: initial CO₂ concentration changes the figures sharply
The article reports power of approximately 50 W and calculates specific energy consumption (SEC) from the decrease in CO2 concentration. SEC depends strongly on the initial concentration and differs substantially between the high and low starting cases, so the actual gas-stream concentration must be known before assessing economics. [1]
| Reported case | Duration | Reported SEC* |
|---|---|---|
| CO2 approximately 7,500 → 600 ppm (higher start) | 10 minutes | 11.9 kWh/kg CO2 |
| CO2 approximately 1,000 → 600 ppm (lower start) | 35 minutes | Approximately 720 kWh/kg CO2 |
Keep in mind*Approximate values reported in [1], p. 5, calculated from CO2 changes in the experimental setup, not whole-system values. Before benchmarking or scaling, measure actual plasma, pump and ancillary power, operating time and quantified products. To include PAW value, define the volume and properties of usable water.
Track CO, O₃ and outlet gases alongside CO₂
With gliding arc on, the researchers detected CO and O3 alongside CO2 changes. Development must consider both the intended outcome and co-produced gases, and should build outlet-gas monitoring, flow control and ventilation into the design from the start. [1]
Keep in mindThe article proposes gas–water reactions as part of managing plasma-generated species. Quantifying removal requires gas measurements before and after water contact, together with liquid analysis. PAW chemistry alone does not establish complete removal of co-produced gases. [1]
The CO and O3 exposure values below are U.S. occupational reference values, not Thai criteria. They are not reactor-concentration specifications or emissions limits, and they do not replace assessment of requirements applicable at the installation site in Thailand. [6], [7], [8]
| Gas | Agency / Type | Reference value |
|---|---|---|
| CO | OSHA PEL · 8-hour time-weighted average | 50 ppm |
| O3 | OSHA PEL · 8-hour time-weighted average | 0.1 ppm |
| O3 | NIOSH REL · Ceiling | 0.1 ppm, not to be exceeded at any time during exposure |
Keep in mindDistinguish measurements inside the system, at the outlet and in the operator's breathing zone. Chamber values cannot directly establish workplace safety. Ventilation, gas management and alarm points must be assessed for actual operating conditions.
From trial results to a working system
Existing evidence connects gas-composition changes, PAW properties and seedling outcomes. The next step is to assess gas, water, energy and safety together, select conditions, repeat them, and only then increase operating time and output in stages.
| Development question | Additional evidence needed | Decision supported |
|---|---|---|
| Carbon input and output | Gas, dissolved products, deposits and control behavior | Where carbon is converted or transferred, and in what quantity |
| Whole-system energy | Power over time, pumps and ancillary equipment | Energy per usable output |
| PAW quality | Repeatability, post-generation stability and performance in the intended cultivation method | Whether water volume and quality meet user needs |
| Continuous operation | Flow rate, contact time, durability and outlet gases | Conditions for a pilot system |
For scale-up, compare outputs with energy, water and material use to select conditions offering the greatest total value.
Test with your gas and water streams
Send six facts to the Plasma Innovations team at [email protected] to design a small trial linking gas data, water quality, application performance and energy, then select conditions for the next test.
Email the research team[email protected]See other cold plasma use cases →What to prepare
- Gas source
- Flow rate
- CO₂ concentration range
- Source water
- Required PAW volume
- Intended use
References
- N. Tephiruk, S. Homkanchan, J. Puttha, et al., "CO2 reduction and seedling growth enhancement using dual-function gliding arc plasma system," Journal of Environmental Chemical Engineering, vol. 13, no. 5, Art. no. 117567, 2025, doi: 10.1016/j.jece.2025.117567.
- Intergovernmental Panel on Climate Change, "Summary for policymakers," in Climate Change 2023: Synthesis Report, H. Lee and J. Romero, Eds. Geneva, Switzerland: IPCC, 2023, pp. 1–34. [Online]. Available: https://www.ipcc.ch/report/ar6/syr/summary-for-policymakers/. Accessed: Sep. 28, 2026.
- NOAA Climate.gov, "Climate change: Atmospheric carbon dioxide." [Online]. Available: https://www.climate.gov/news-features/understanding-climate/climate-change-atmospheric-carbon-dioxide. Accessed: Sep. 28, 2026.
- A. Fridman, S. Nester, L. A. Kennedy, A. Saveliev, and O. Mutaf-Yardimci, "Gliding arc gas discharge," Progress in Energy and Combustion Science, vol. 25, no. 2, pp. 211–231, 1999, doi: 10.1016/S0360-1285(98)00021-5.
- H.-Y. Chu and B.-T. Liou, "Gap-dependent arrangements of dielectric barrier discharges in open air," Physics of Plasmas, vol. 21, no. 8, Art. no. 083504, 2014, doi: 10.1063/1.4892639.
- National Institute for Occupational Safety and Health, "Carbon monoxide," NIOSH Pocket Guide to Chemical Hazards. [Online]. Available: https://www.cdc.gov/niosh/npg/npgd0105.html. Accessed: Sep. 28, 2026.
- National Institute for Occupational Safety and Health, "Ozone," NIOSH Pocket Guide to Chemical Hazards. [Online]. Available: https://www.cdc.gov/niosh/npg/npgd0476.html. Accessed: Sep. 28, 2026.
- Occupational Safety and Health Administration, "Table Z-1, Limits for air contaminants," 29 CFR 1910.1000. [Online]. Available: https://www.osha.gov/laws-regs/regulations/standardnumber/1910/1910.1000TABLEZ1. Accessed: Sep. 28, 2026.