

Cold Plasma / UC06
Use case UC06 · Sunflower microgreens
Similar germination can still produce different numbers of saleable plants
The goal is not just germination but more microgreens reaching the required size, uniformity and saleable quality in the same harvest cycle. The team's research tested DBD seed-surface treatment and PAW irrigation to find the route that fits your growing system.
Research by Assoc. Prof. Dr. Siwapon Srisonphan and the Plasma Innovations team, Department of Electrical Engineering, Kasetsart University
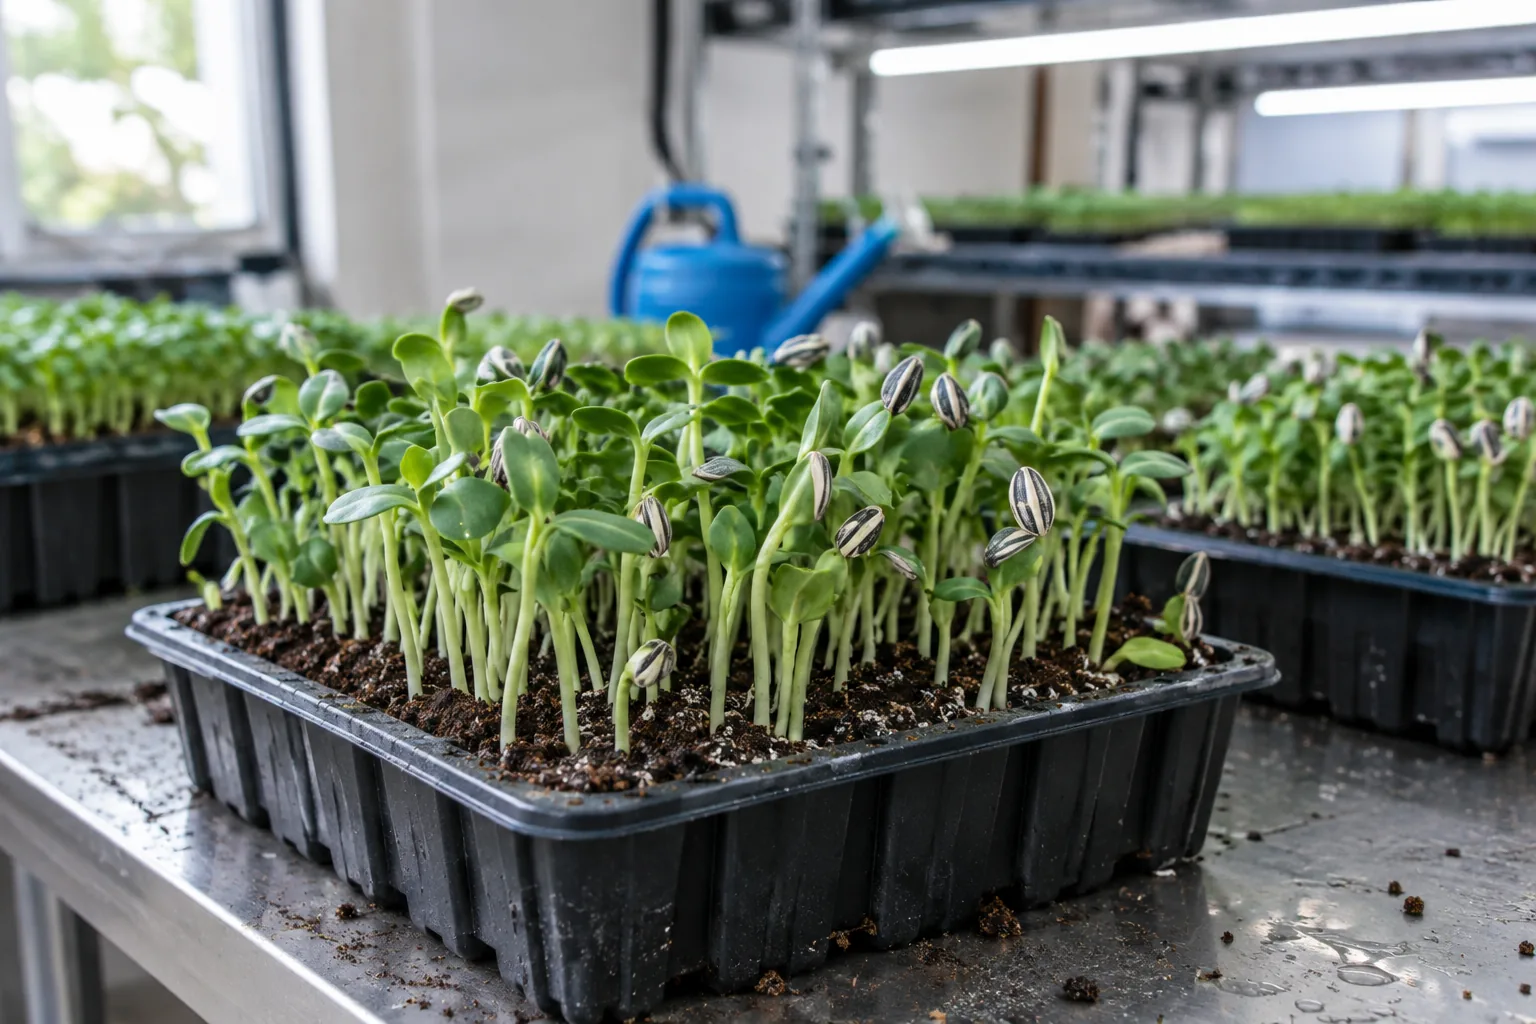
≈80%Germination in all 4 groups, similar; the difference lies in growth after germination
≈52% vs ≈40%Seedlings longer than 7 cm, DBD+PAW versus control, as a share of all seeds sown
125° → 35°Water contact angle on the upper seed surface, before and after DBD
>85%Shorter droplet absorption time, from ≈3,270 to ≈450 seconds on the upper seed surface
Figures in this article are laboratory results under the conditions of the cited studies. Results with your own lot or growing system need to be tested.
Similar germination, different saleable output
Germination percentage is only the first step. For growers, the more useful question is how many germinated seeds reach a size and quality you can sell, when you need them. In the team's research, sunflower microgreens germinated at about 80% in every group, yet length, weight and the fraction reaching target size differed clearly [1].
The team therefore tested plasma at two early-stage points: treating the seed surface with dielectric barrier discharge (DBD) before sowing, and growing with plasma-activated water (PAW). The results help frame questions for three groups.
- Commercial growers: uniform microgreens, faster and more predictable seed preparation, and fewer plants to discard
- Seed producers and suppliers: whether lots respond differently, and whether seed pretreatment can become a new benefit for customers
- Growing-system developers: a measurable control point at seed preparation or water delivery that fits the existing system
Before starting, define your sales specification: minimum length, fresh weight, uniformity or harvest date, and apply the same criteria to every group. If germination is similar but size distribution differs, investigate early water uptake and post-germination growth by measuring length, weight and size distribution, then decide whether to intervene at the seed, the water or both.
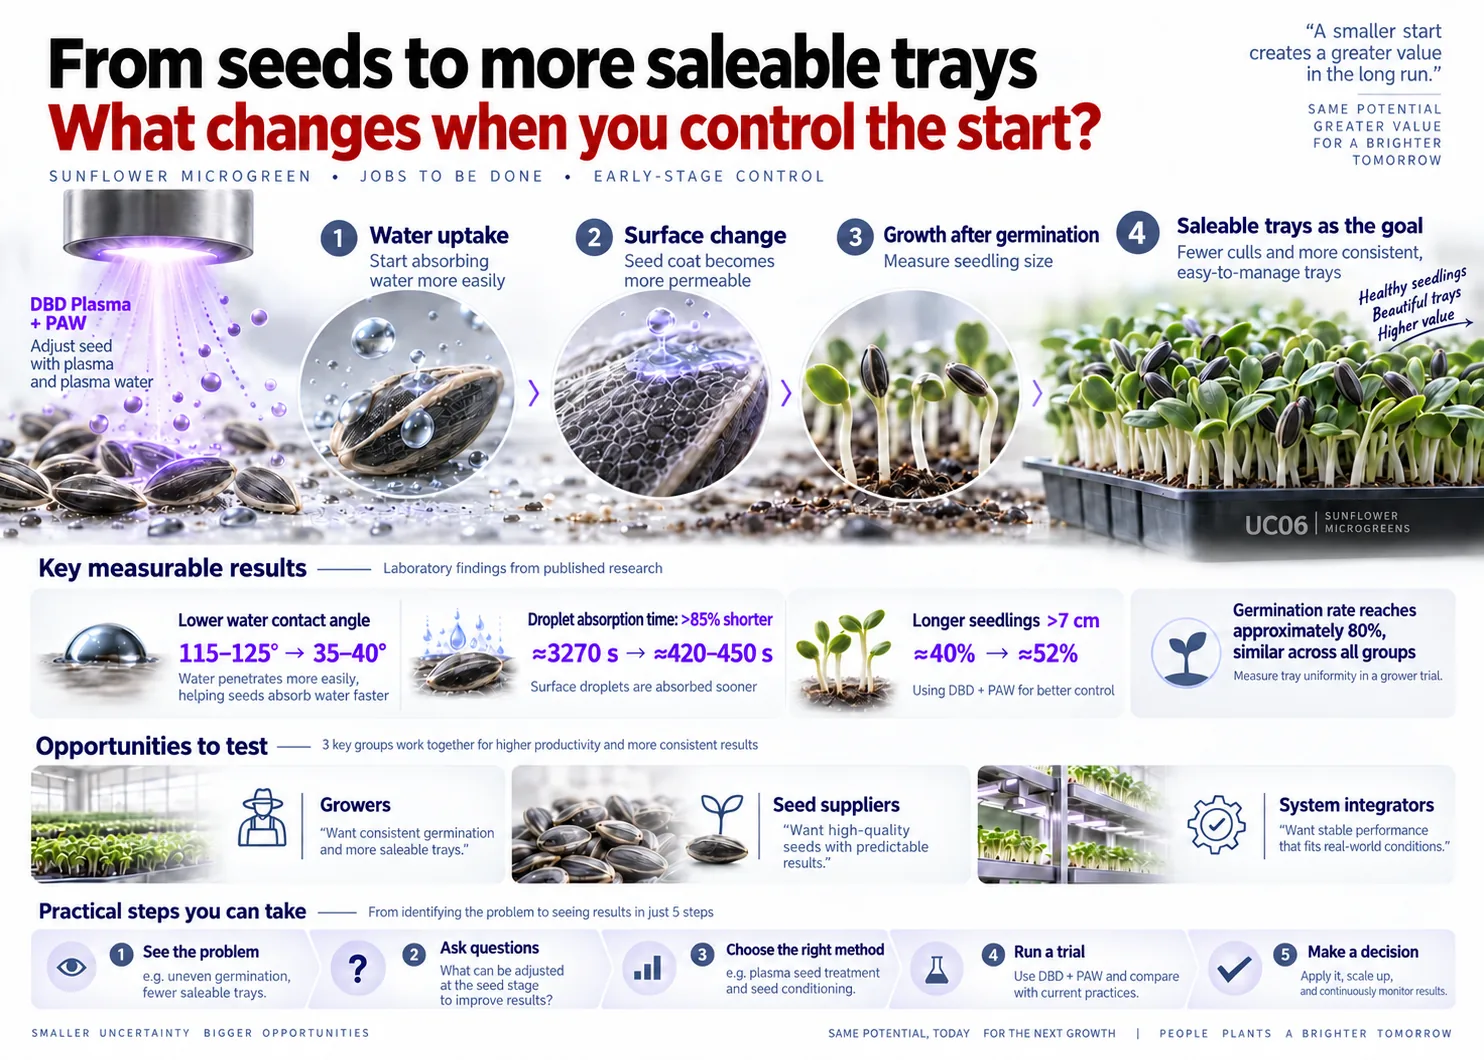
Plasma fits two steps you already run
You do not need to replace the whole growing system. Route one treats the seed surface with DBD before sowing, so water spreads over the hull and enters more readily. Route two prepares PAW with measurable composition and delivers it through the existing irrigation cycle. Use either route or both, and compare with your current method in the same growing cycle.
Plasma is an energized gas containing charged particles and reactive species. A DBD system has a dielectric barrier in its electrode structure to help control the discharge. This study focuses on the outer seed surface, the first interface with water. PAW exposes water to plasma before that water is applied to plants, which adds questions about preparation, storage and delivery.
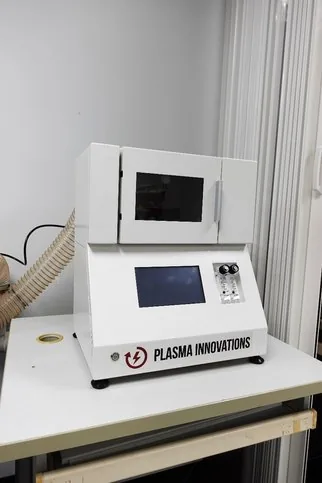
In an existing system, seed treatment is added before preparation and sowing, while PAW is prepared and delivered through the current irrigation cycle. For growers, the seed route tests whether surface-treated seeds can be prepared faster and produce more microgreens that meet the size specification. Seed suppliers can build lot-specific response data and evaluate how long treated seeds can be stored before delivery. System developers can design seed- or water-preparation modules with their own quality metrics.
If seed preparation is the bottleneck, start with the seed route. If you already manage irrigation, the water route can be studied alongside existing work. Species and lots respond differently, so treat these results as a starting point for finding conditions that suit your actual lot.
Seedling outcomes: similar germination, different growth
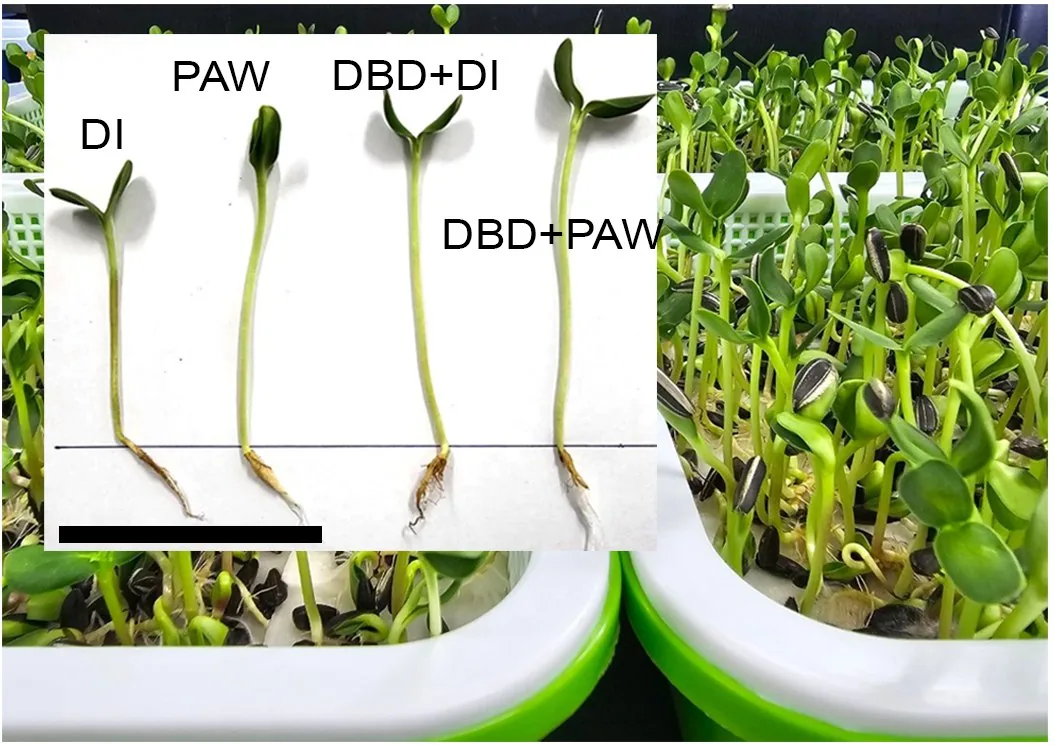
The experiment used 4 groups, 4 replicates per group and 100 seeds per replicate, measured after approximately 9 days [1].
- DI: untreated seeds + DI water (control)
- PAW: untreated seeds + PAW
- DBD+DI: plasma-treated seeds + DI water
- DBD+PAW: both routes combined
| Metric | Result |
|---|---|
| Germination | ≈80% in all groups, with no significant difference shown |
| Mean length | Longest with DBD+PAW, about 9.5 cm versus about 7 cm in the control (read from the graph); each single route was also longer than the control |
| Seedlings longer than 7 cm | DBD+PAW ≈52% versus ≈40% in the control, with the smallest fraction shorter than 7 cm |
| Fresh weight | PAW and DBD+PAW were heavier than the control and belonged to the same statistical group |
DBD+DI isolates the seed-side change, PAW isolates the water-side change, and DBD+PAW shows how the combination compares with either route alone. Here, plasma affected the post-germination size distribution, the same factor that decides how much of a tray meets the sorting specification.
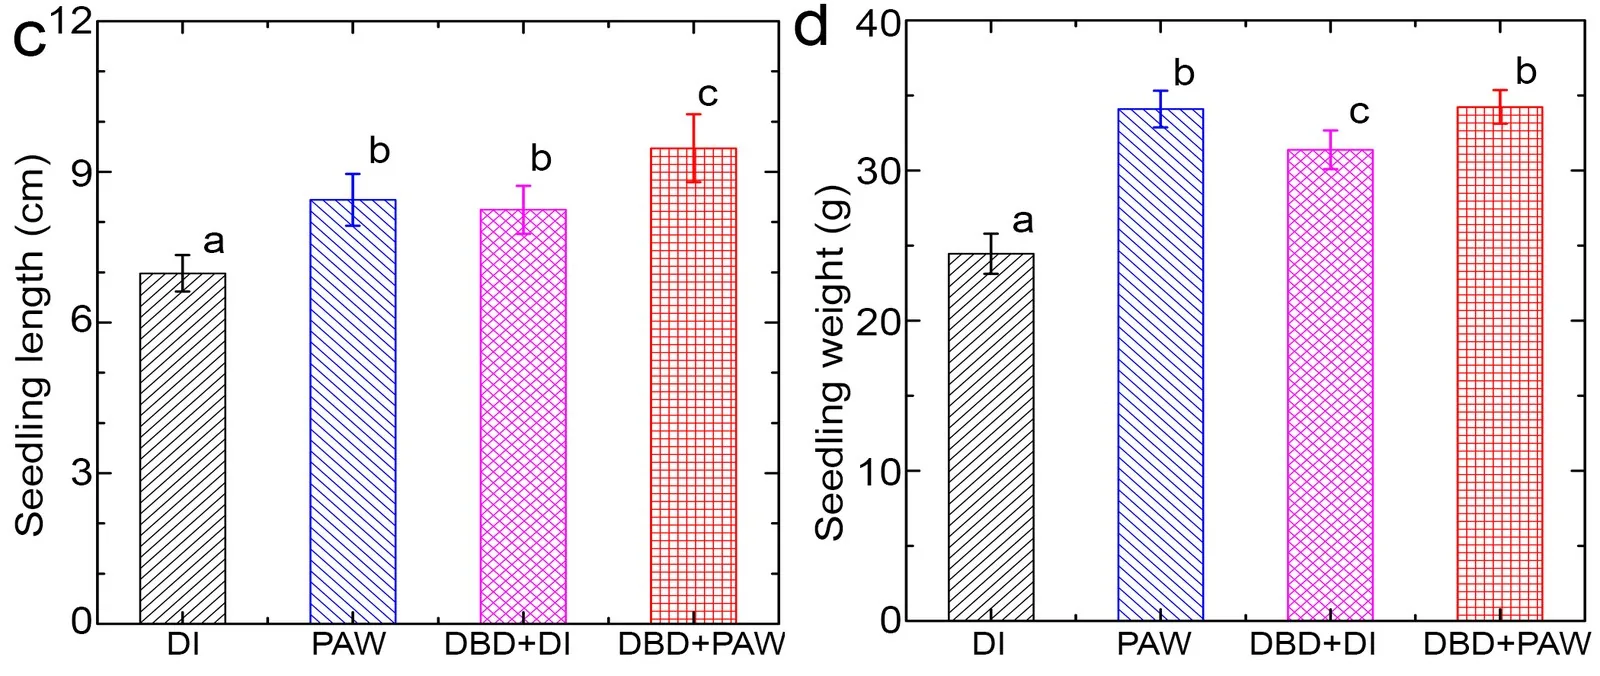
Keep in mindFor fresh-weight decisions, read the original graph and statistical groups. Do not interpret percentages or bar heights apart from the measurement method and experimental variation.
The seed route: a water-repellent surface becomes wettable
Before treatment, a water droplet sits relatively rounded on the sunflower hull. After DBD under the studied conditions, it spreads farther and absorbs sooner. The water contact angle fell from about 125° to about 35° on the upper surface and about 40° on the lower surface, and the time to complete droplet absorption on the upper surface fell from 54.5 minutes to 7.5 minutes, more than 85% shorter [1].
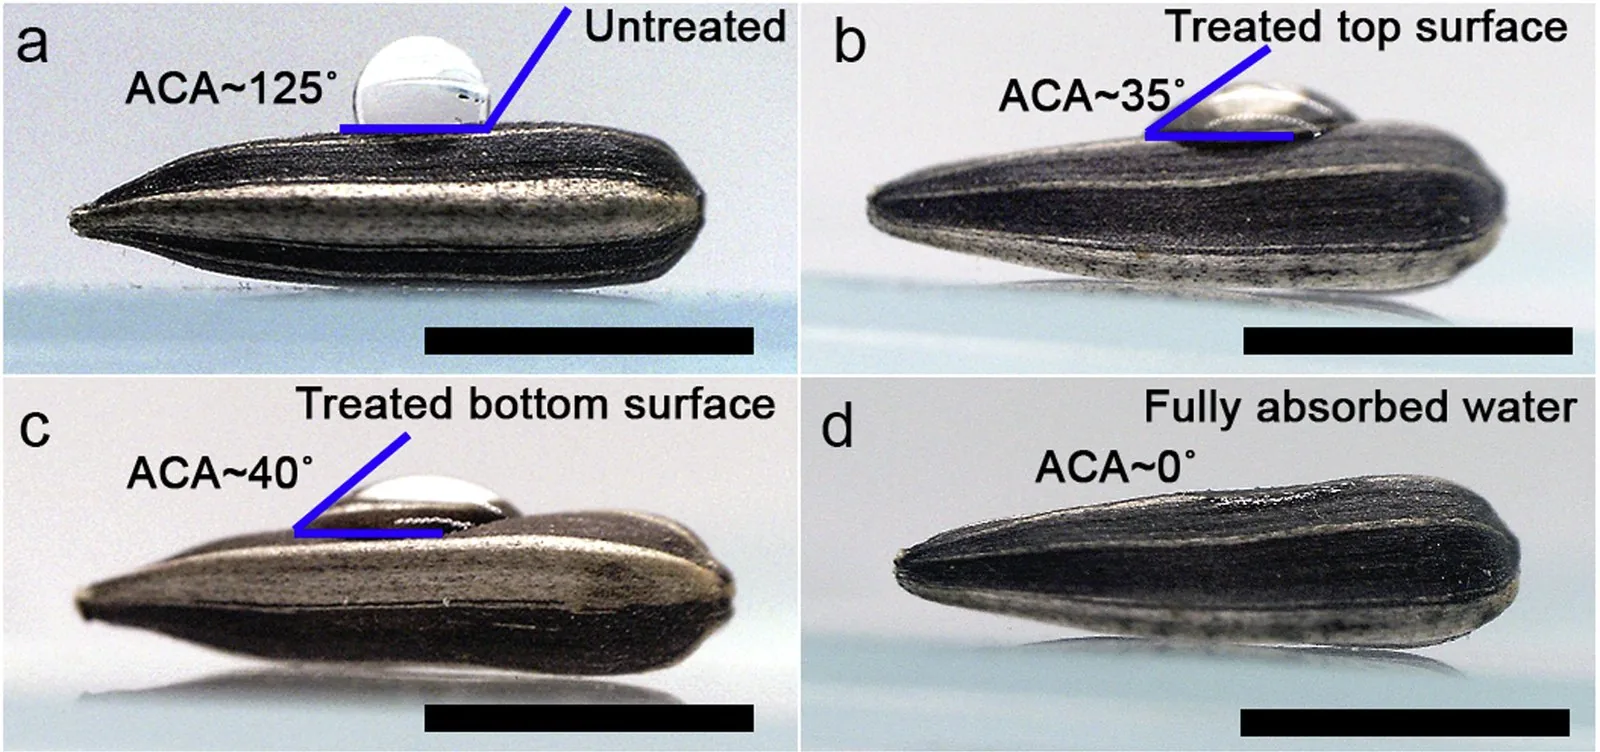
The study used 2 µL DI-water droplets. Contact angle describes how a droplet sits or spreads; absorption time tracks how long it takes to disappear into the seed. The angles of 125°, 35° and 40° come from the examples shown. About 450 seconds is the reported droplet-test result, while about 420 seconds comes from the model curve, so they are different types of information.
The study's graph shows complete droplet absorption time decreasing with treatment duration on both the upper and lower seed surfaces, measured on 50 seeds ±2 SD, with dashed model lines. Its time axis describes the study, not a machine setting.
Wettability is therefore a variable that can be adjusted and measured before sowing, opening a seed-preparation option beyond changing soaking time alone. The next question is how much faster a whole batch takes up water, and whether that makes microgreens in an actual lot more uniform.
- During treatment: optical emission spectroscopy (OES) reports OH and nitrogen signals, alongside other spectral features, helping identify species under operating conditions
- After treatment: scanning electron microscope (SEM) images show surface morphology, while contact angle and absorption time show the water response
- During cultivation: the growing-group comparison measures germination, length and weight, linking treatment to plant outcomes under the tested conditions
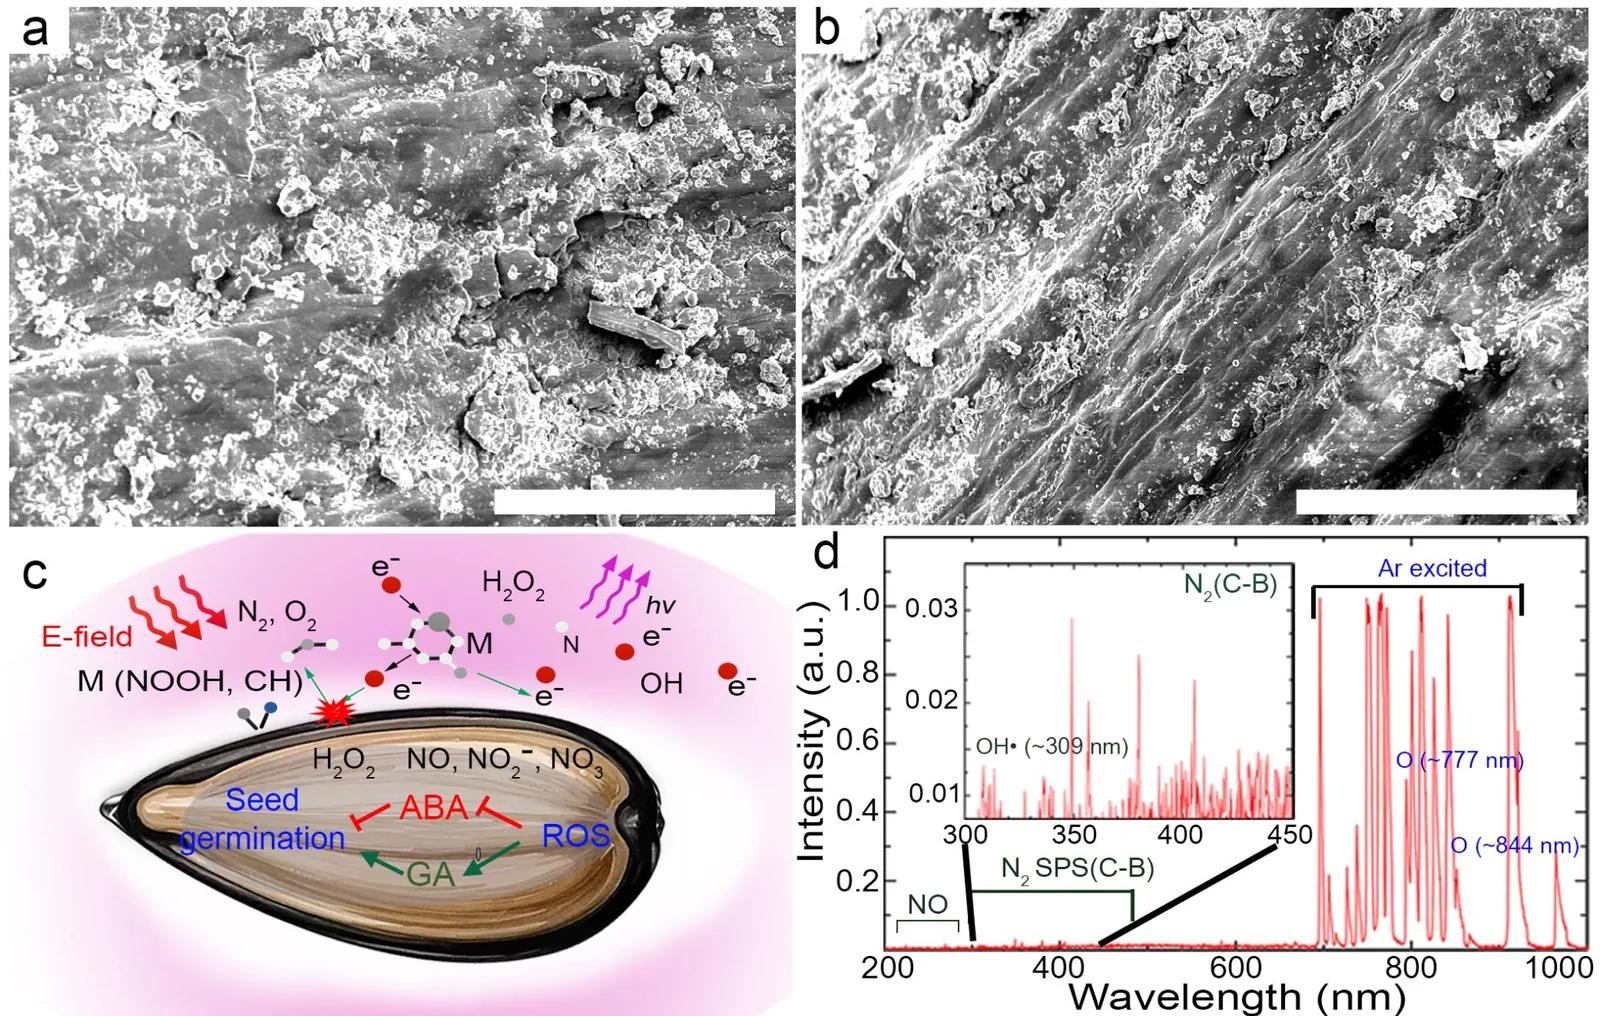
Keep in mindThese values come from droplets on the seed surface (n = 50 seeds), not whole-batch soaking. SEM images show changes in surface morphology but do not establish surface chemical composition. OES characterizes the plasma during operation, electric-field simulations describe conditions around the seed, and panel 3c illustrates a proposed explanation. Identifying molecular mechanisms requires further analysis.
The water route: changing only the water changed the seedlings
Untreated seeds grown with PAW produced longer, heavier seedlings than the DI-water control, without any seed pretreatment. The experimental PAW contained hydrogen peroxide (H2O2) at about 30 mg/L and nitrate (NO3−) at about 250 mg/L, while H2O2 was not detected at the measured level in DI water [1].
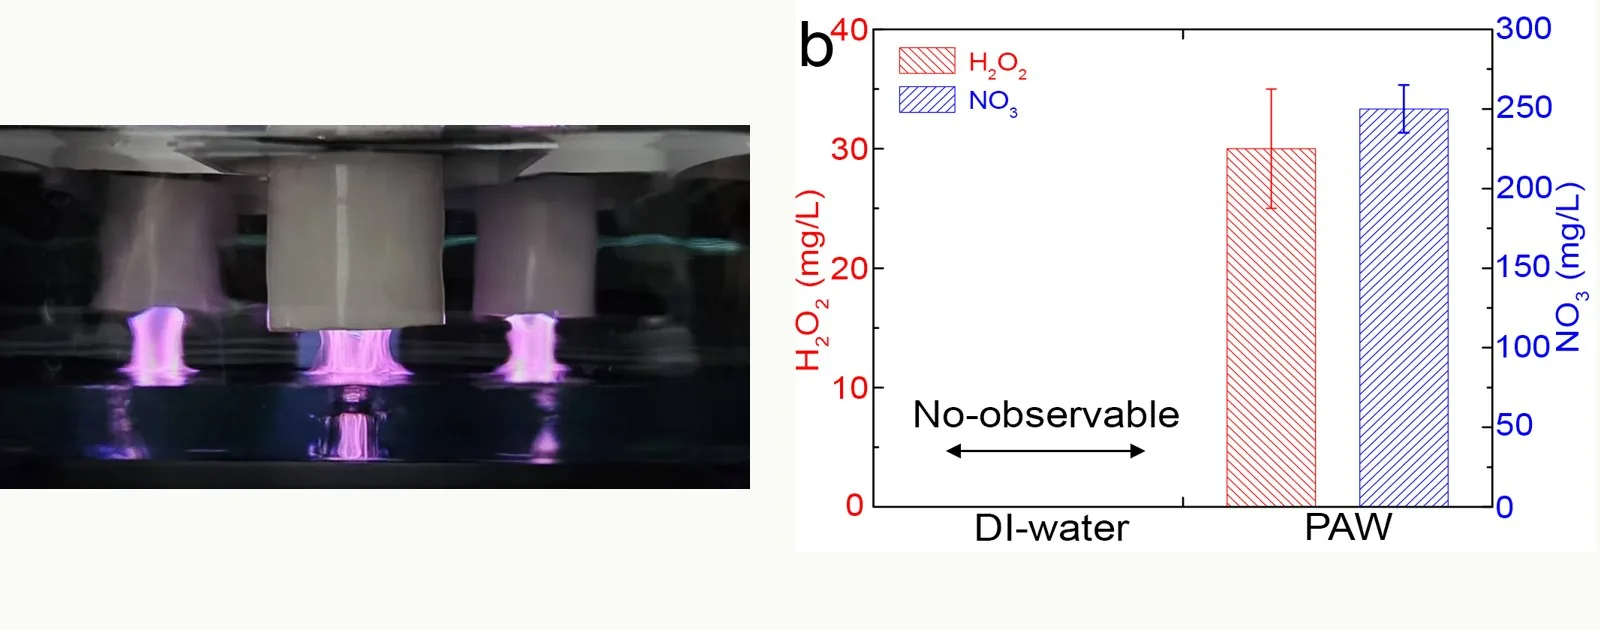
A separate study by the team examined PAW with sunflower seedlings independently of the experiment above and reported greater seedling length and weight with PAW than with DI water [2]. Both studies point the same way: PAW is worth testing with growers' actual water systems.
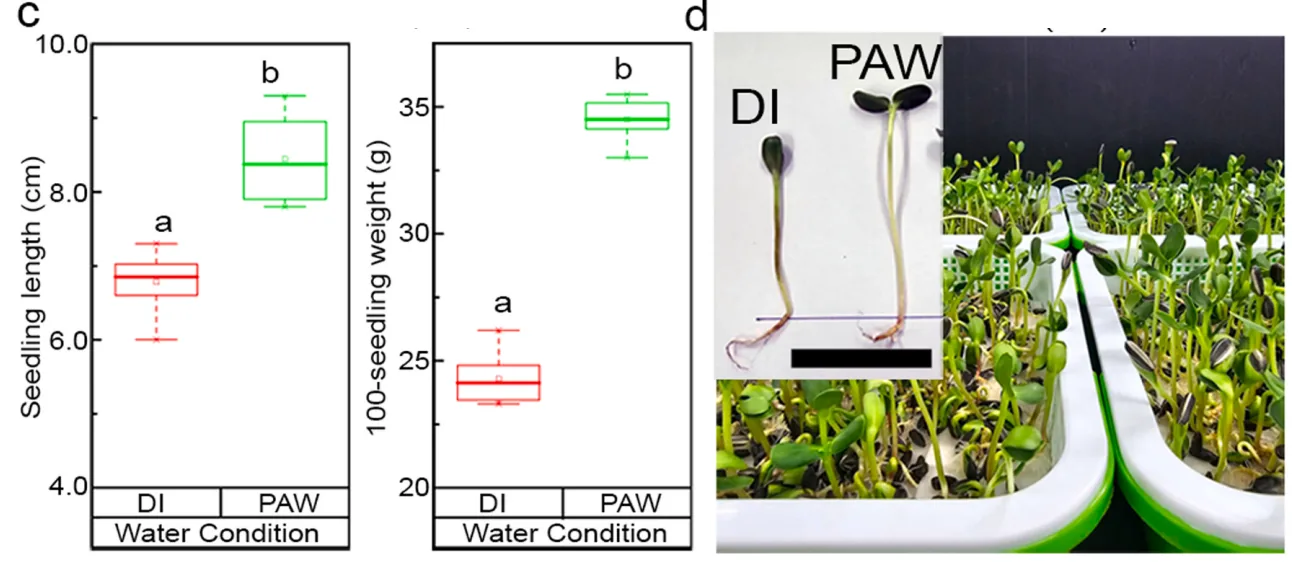
This route connects with a daily farm task: irrigation. Water becomes a medium whose properties can be specified and checked before use. For system developers, it offers a clear link to existing water-preparation and delivery lines. The practical question is whether PAW improves on the farm's current water, and whether that benefit justifies the added preparation time and resources.
Using PAW starts with knowing how each batch was made, its source water and how long it was held before reaching the tray. These records connect seedling outcomes with the water actually applied. For water-system developers, the opportunity therefore goes beyond producing the water to specifying point-of-use properties, managing holding time and fitting the cultivation process.
Keep in mindThe reported results use DI water as the comparator. Farm trials should use the grower's current water and irrigation practice as the baseline. H2O2 and nitrate are the metrics reported here; pH and electrical conductivity may complement water checks in further development. No single metric describes every property of the water.
Choose DBD, PAW or both around the outcome you need
Length and weight answer different questions. DBD+PAW produced the greatest mean length after approximately 9 days, while for fresh weight PAW and DBD+PAW shared the same statistical group. PAW therefore stands out for weight, and the combination stands out for length.
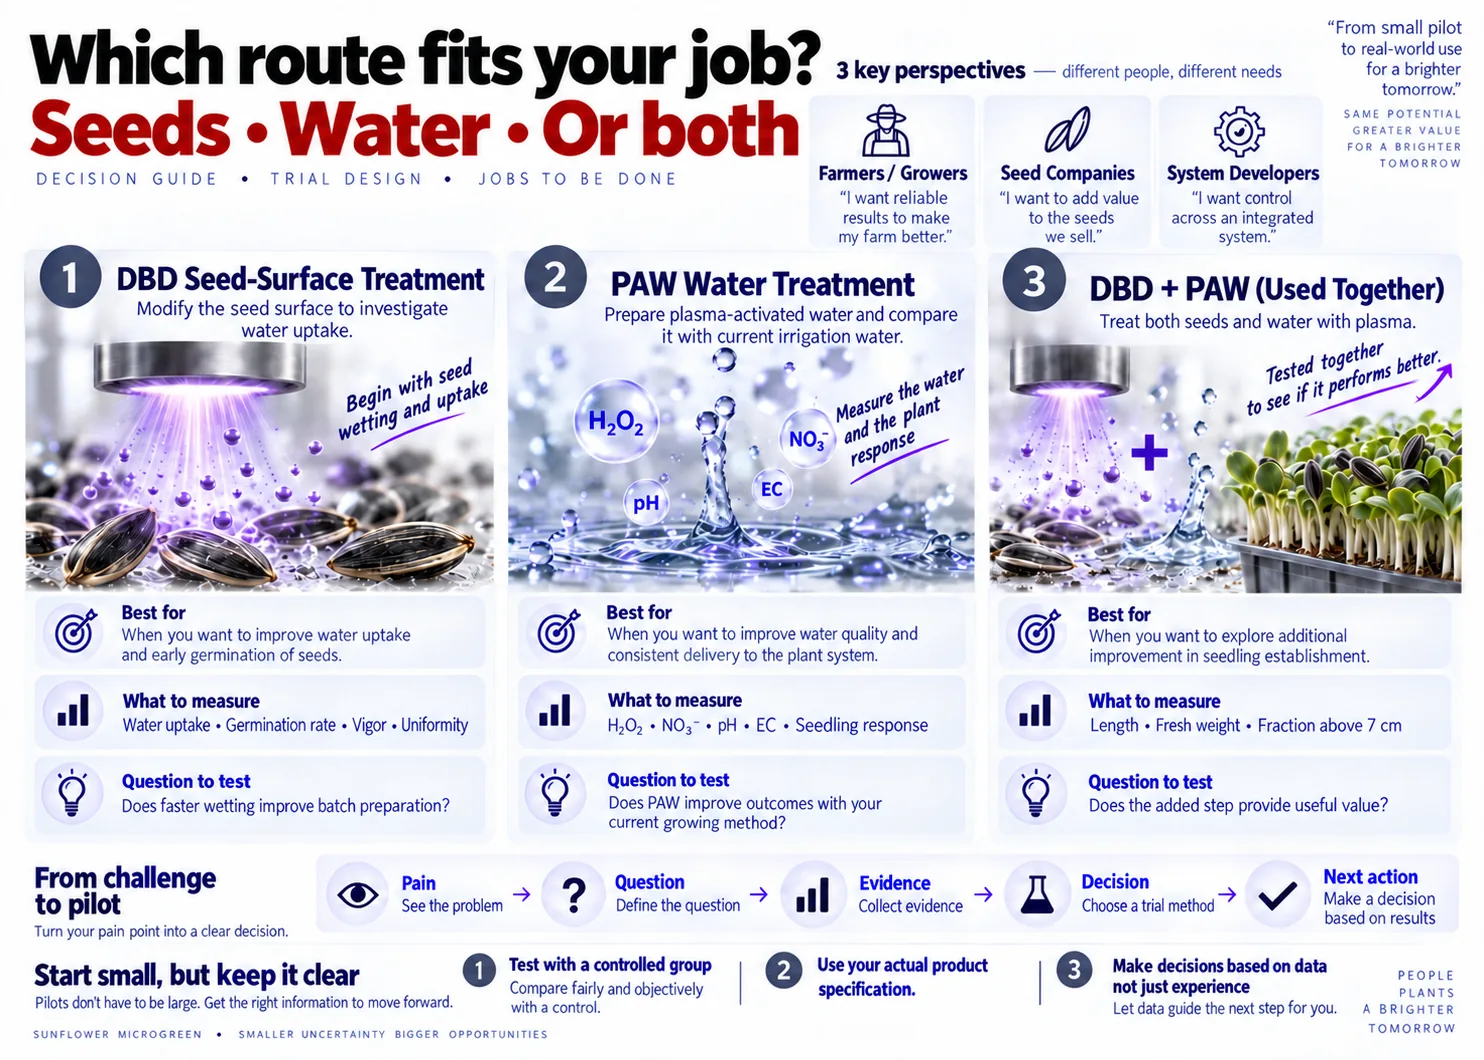
- Choose DBD when the question is seed water uptake, or lots differ in how they take up water
- Choose PAW when you want to start from irrigation, or seedling weight is the priority
- Test both when the goal is a larger fraction meeting the tray specification, weighed against the added process steps
The same dataset can support different choices. A grower already meeting the size specification may prioritize saleable weight and labor, while a seed supplier may prioritize uptake and lot-specific response. Developing the seed and water routes separately shows the value of each before combining them in one process.
Growers know the practical constraints: preparation windows, space, the sizes customers accept and reasons for rejection. The plasma team contributes treatment, water-preparation and measurement expertise to turn those constraints into an informative comparison. A starting question might be “Does PAW change seedling size on our current harvest day?” or “Does this lot take up water differently during soaking after surface treatment?” Such questions define a clear scope.
Keep in mindThe highest combined mean alone is not proof of synergy between DBD and PAW. Establishing synergy requires a design that separates each factor and tests their interaction. This result is a starting point for further trials.
Do longer seedlings mean more saleable output per tray?
Germination, length and fresh weight are distinct metrics. The researchers grouped seedlings above and below 7 cm using all seeds sown as the denominator, not only germinated seeds.
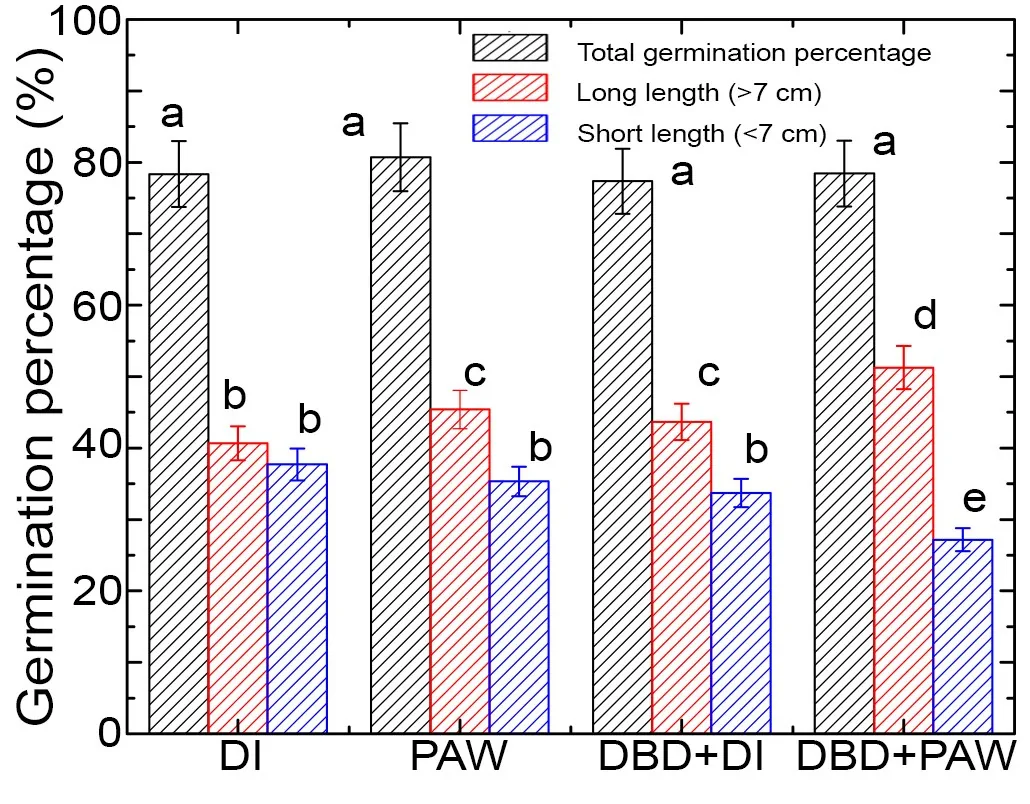
Two trays can have similar mean length while one is uniform and the other mixes very short and very long plants. Individual measurements or product-specific size bands reveal variation that a mean and two categories cannot fully describe.
Research fresh weight also differs from weight after trimming and sorting. Record size before harvest, then weigh the passing and rejected fractions with rejection reasons, using identical sorting criteria across groups so the comparison reflects the tested intervention.
Keep in mindThe 7 cm threshold is this study's comparison point, not a product specification. Each grower must define sorting criteria for their own product.
Test with real trays: answer product and workflow questions
Laboratory results are the starting point. The next step is a tray-scale trial with the grower's seeds, substrate, water and product criteria, using the current method as the control in the same cycle.
| Observed in the study | What to test in your operation |
|---|---|
| Contact angle fell from ≈125° to ≈35–40° | Do your cultivar and seed lot respond similarly? |
| Complete droplet absorption time fell by more than 85% | How much can whole-batch soaking time actually be reduced? |
| PAW had measurable chemistry and produced longer, heavier seedlings than DI water | Results against farm water, and how water composition relates to the seedling response |
| Similar germination, longer seedlings and a larger fraction above 7 cm | Does that size meet your product specification, and what saleable weight remains per tray after sorting? |
| Initial evidence for designing practical trials | Whole-tray uniformity, repeatability across cycles and process economics |
- Product: weight after sorting, size, appearance and harvest readiness date
- Process: preparation time, handling, water and energy use
- Repeatability: performance across seed lots and growing cycles
Read the results from three angles. For product quality, connect growth with sorting criteria: size, appearance and saleable weight. For operations, track how variation between plants and trays affects harvest timing and sorting effort. For system development, decide whether to start with seeds, water or both, considering available space, equipment and data. If the product must reach a consistent size on one harvest day, focus on size distribution and the passing fraction; if preparation is the bottleneck, focus on water uptake and consistency at that step.
Sowing density, substrate, light and irrigation should reflect real operations; changing many factors at once makes the source of any difference hard to identify. Track emergence, canopy coverage and seedling size, with photos from consistent positions and times. Then compare added labor, water, energy and handling with the output that meets specification to estimate cost per saleable unit from actual tray data.
Existing evidence covers wetting changes, droplet tests, PAW composition and seedling comparisons, so development can begin from results that can be checked. A repeatable process, however, needs seed-batch and tray-level data across lots and growing cycles. Harvest timing, saleable output, energy and cost are metrics to define with the user.
Make the result repeat, then scale to a working process
A good result must repeat across lots and growing cycles. For seeds, record the lot, treatment conditions and interval before sowing. For water, record the source, PAW preparation, container and holding time, because PAW composition depends on generation and storage conditions [3]. Freshly generated water may therefore differ from water held before delivery. Choose point-of-use water checks suited to the question, such as pH, conductivity and relevant species.
In system development, seeds are three-dimensional objects with varying orientations, so layer depth, orientation and movement must be controlled for consistent treatment across the lot. Seed preparation capacity, treatment-cycle time and PAW volume must match cultivation capacity. As work scales, add food-safety, nutritional and post-harvest shelf-life checks, and assess water handling, electrical systems, ventilation, cleaning and maintenance for the actual site.
If one cycle responds differently, linked seed, water and growing-condition records help identify what changed. Automation may help control seed movement, track water batches and link records to trays, but cameras and sensors should be chosen for the information needed for decisions. Scale-up therefore requires developing the whole process alongside the plasma source, in line with what the evidence supports.
Choose a collaboration model and make the first trial decisive
Growers, seed suppliers and system developers control different parts of the process. Start where each partner can make a change and use the result.
| Development partner | Starting point | Key question |
|---|---|---|
| Microgreen growers | Seeds, water or both | How do quality and saleable weight per tray change? |
| Seed suppliers | Seed-surface treatment | How does each lot respond, and how long can treated seeds be stored? |
| Water-system developers | PAW preparation and delivery | How can point-of-use water properties be maintained, and do seedlings respond? |
| Growing-system developers | Process and data integration | Can the result repeat across cycles, and how much handling is added? |
Seed suppliers might start by building lot-specific data on wetting, uptake, germination and performance after treated-seed storage, then explore pretreatment or treatment-service models if the evidence supports it. System developers might begin co-design with a clearly bounded water-preparation or seed-handling step, defining quality, throughput and interfaces with the existing system before pilot testing. Future options therefore include co-development, plasma treatment services, pilot systems and modules for equipment manufacturers, each evaluated against repeatable quality and partner needs.
After initial trials, work may continue as repeat testing, seed-specific conditions, a pilot system or module co-design, depending on results and the agreed scope. Other crops require species-specific response screening. Plasma Innovations Co., Ltd. works with partners to define the problem and develop applications: customers bring product and process knowledge, and the team brings plasma and measurement expertise.
- Microgreen farms: can more plants meet specification on the same harvest day? Compare the current method with the selected route using farm sorting criteria, recording the passing fraction, weight after sorting and sorting time
- Seed suppliers: can surface-treated seeds wait for delivery to growers? Track wetting and cultivation outcomes after agreed storage intervals across several lots
- Water-system developers: how different is the water at generation and at the tray? Check PAW after generation and at use, linking holding time and delivery cycles to define pilot-system control points
The first trial should be clear enough to decide whether to continue, adjust or scale. Start by agreeing one primary question, test at a suitable scale against your current method in the same cycle, then decide from the results. When the joint trial ends, you should know three things.
- Product outcome: did size, uniformity, saleable weight and the passing fraction actually change?
- Operational outcome: what additional time, labor, water, energy or process control is required?
- Decision: which route fits your operation and is worth repeating or scaling?
Keep in mindThe development stages, partner roles and collaboration models in this section are proposed pathways based on laboratory results, not installed systems.
Discuss a trial with your seeds
Send the research team your seed details, growing method, harvest day and sorting criteria, and we will design a trial together comparing DBD, PAW or the combination with your current method. Comparison groups, metrics, duration and cost are agreed before starting. The output covers tested conditions, comparison with the current method and a recommendation to repeat, adjust or scale. Contact [email protected]
Email the research team[email protected]See other cold plasma use cases →What to prepare
- Seed species and lot, plus your current seed preparation or soaking method
- Water source and irrigation schedule
- Substrate, light and sowing density
- Harvest window and cutting day
- Sorting criteria and reasons for rejection
- One primary question you want the trial to answer
References
- Srisonphan S., Tephiruk N., Homkanchan S., Puttha J., Suwannarat S., Teerakawanich N. (2025). Synergistic DBD plasma and plasma-activated water enhance sunflower seed surface wettability and germination. Results in Engineering, 26, 105434. doi:10.1016/j.rineng.2025.105434
- Tephiruk N., Homkanchan S., Puttha J., Suwannarat S., Teerakawanich N., Kanokbannakorn W., Srisonphan S. (2025). CO2 reduction and seedling growth enhancement using dual-function gliding arc plasma system. Journal of Environmental Chemical Engineering, 13(5), 117567. doi:10.1016/j.jece.2025.117567
- Rotondo P. R., Aceto D., Ambrico M., Stellacci A. M., Faretra F., De Miccolis Angelini R. M., Ambrico P. F. (2025). Physicochemical properties of plasma-activated water and associated antimicrobial activity against fungi and bacteria. Scientific Reports, 15, 5536. doi:10.1038/s41598-025-88369-7